Weekly stock market & economy update

S&P 500 earnings update

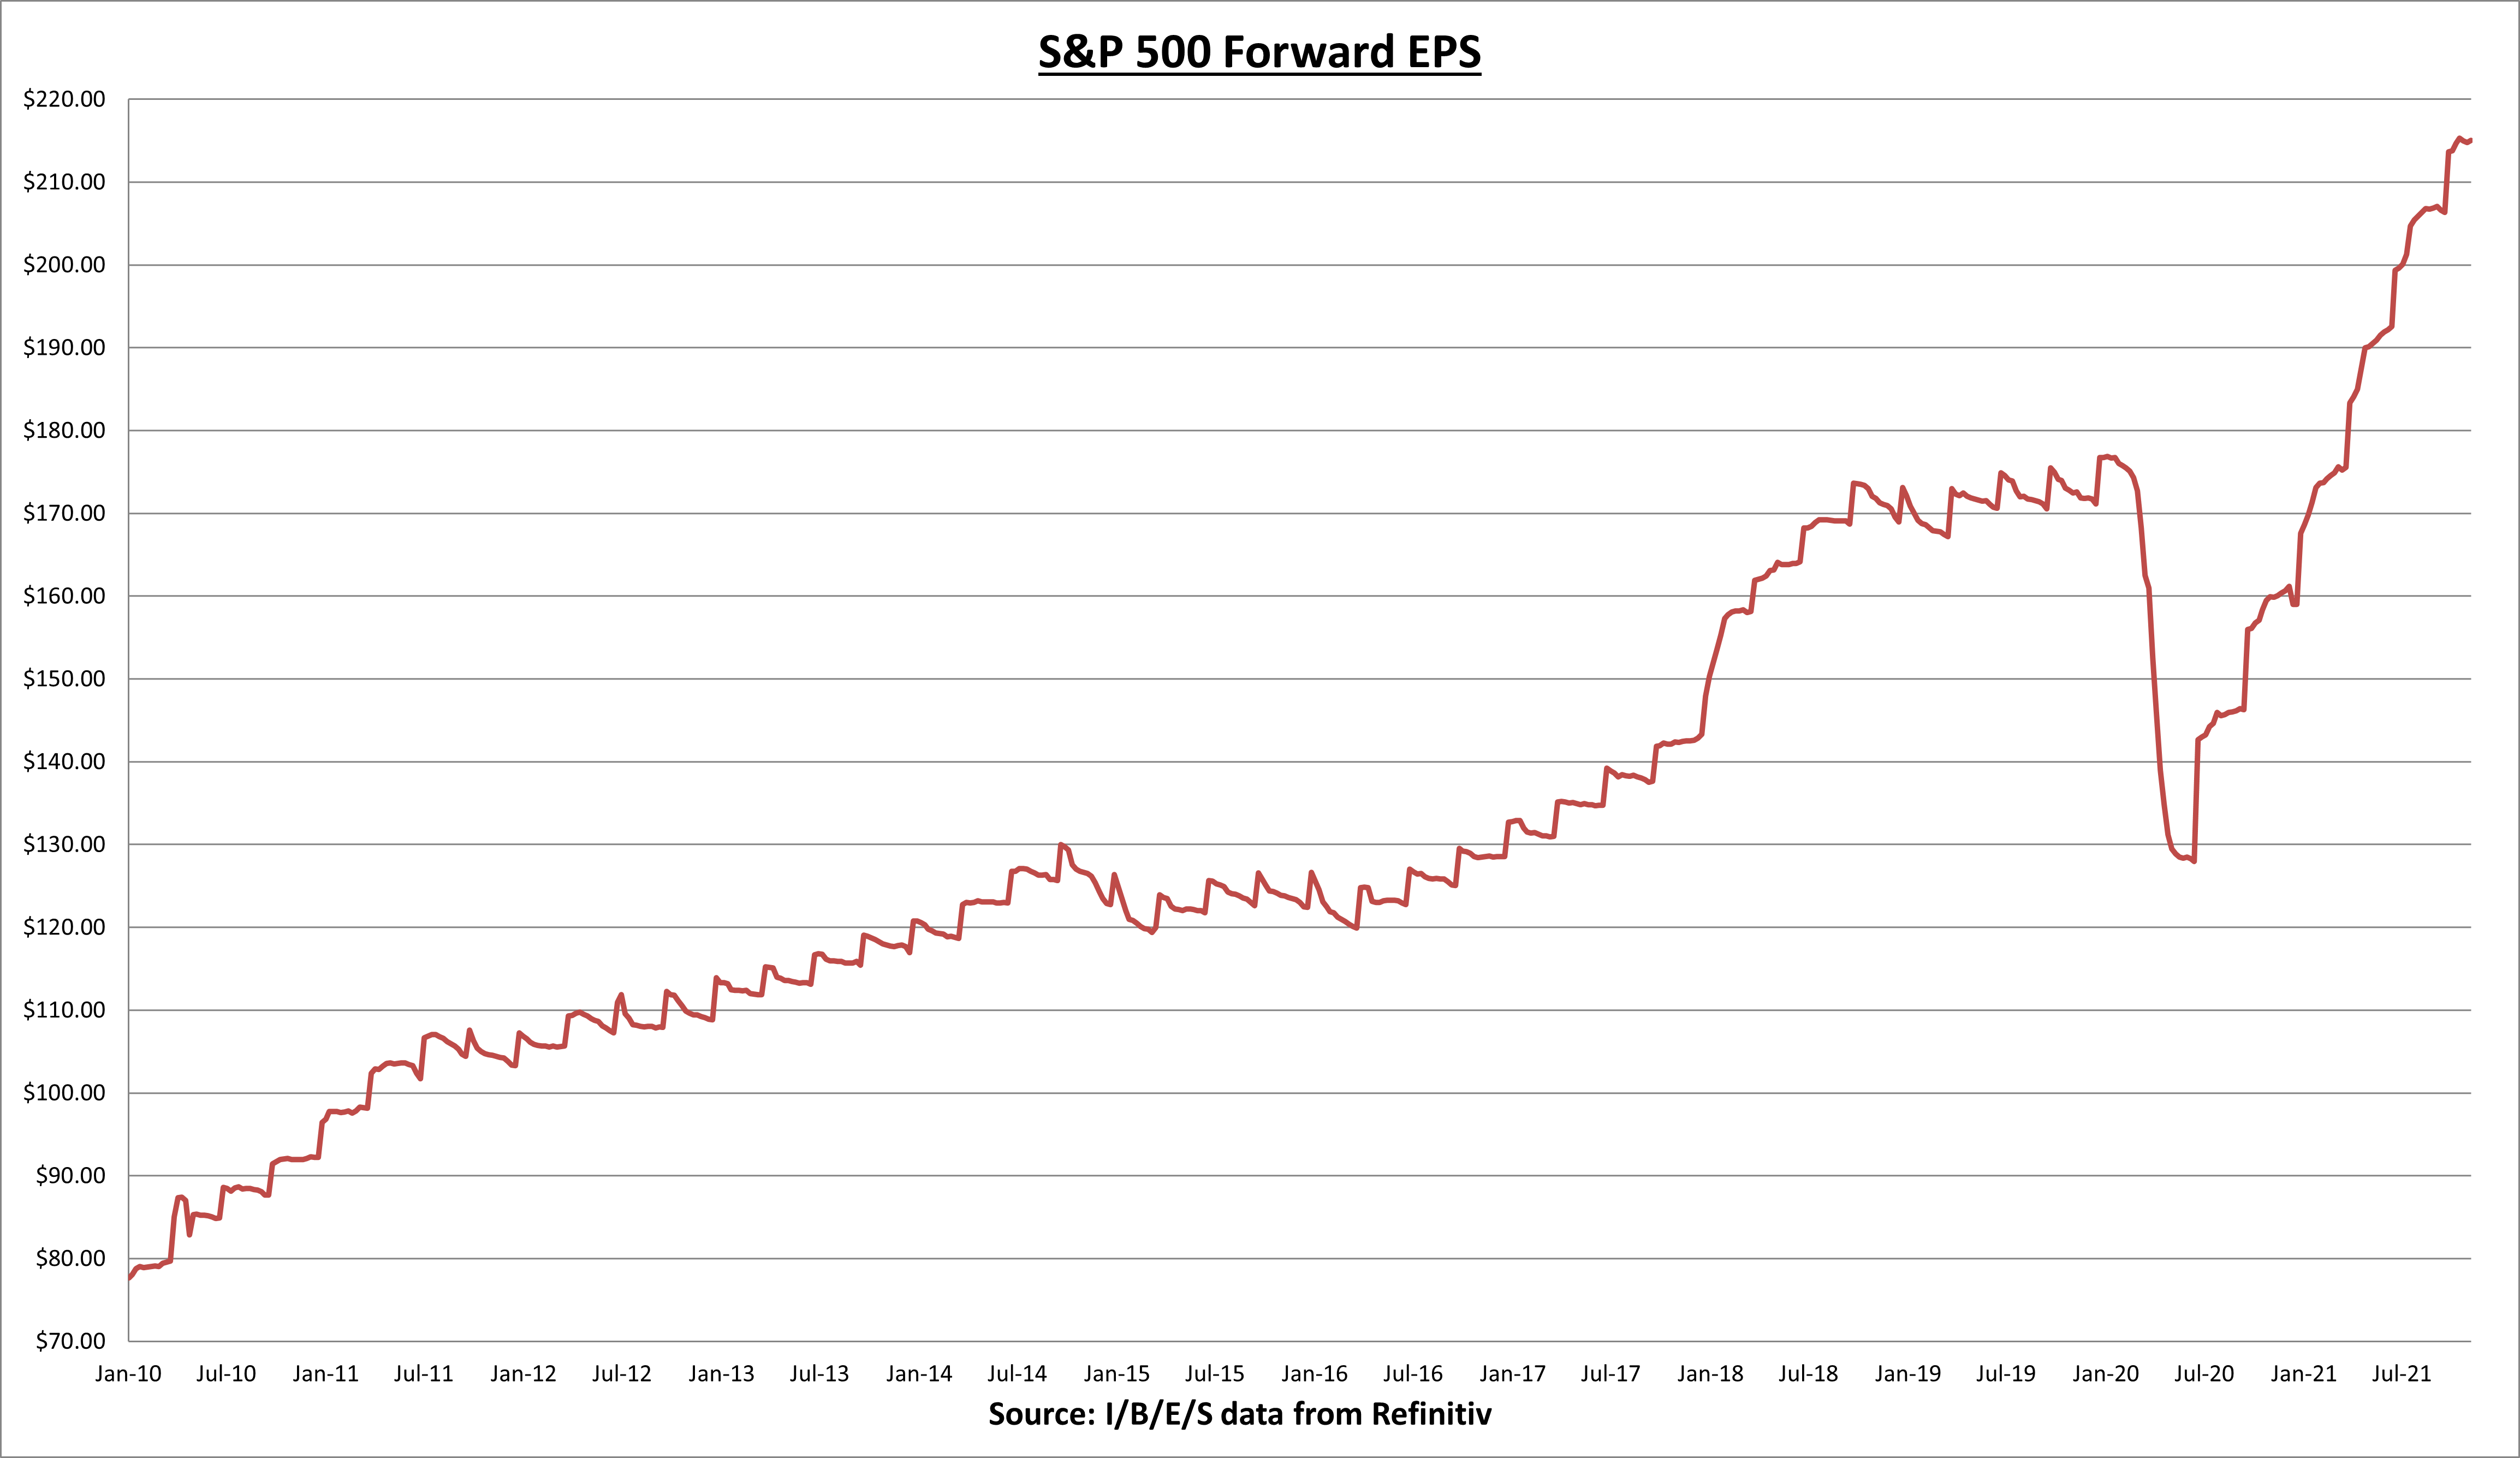
S&P 500 earnings per share (EPS) increased to $216.90 this week. The forward EPS is now +36.4% year to date. I expect another sizeable increase in the forward EPS as we roll into a new quarter/year.

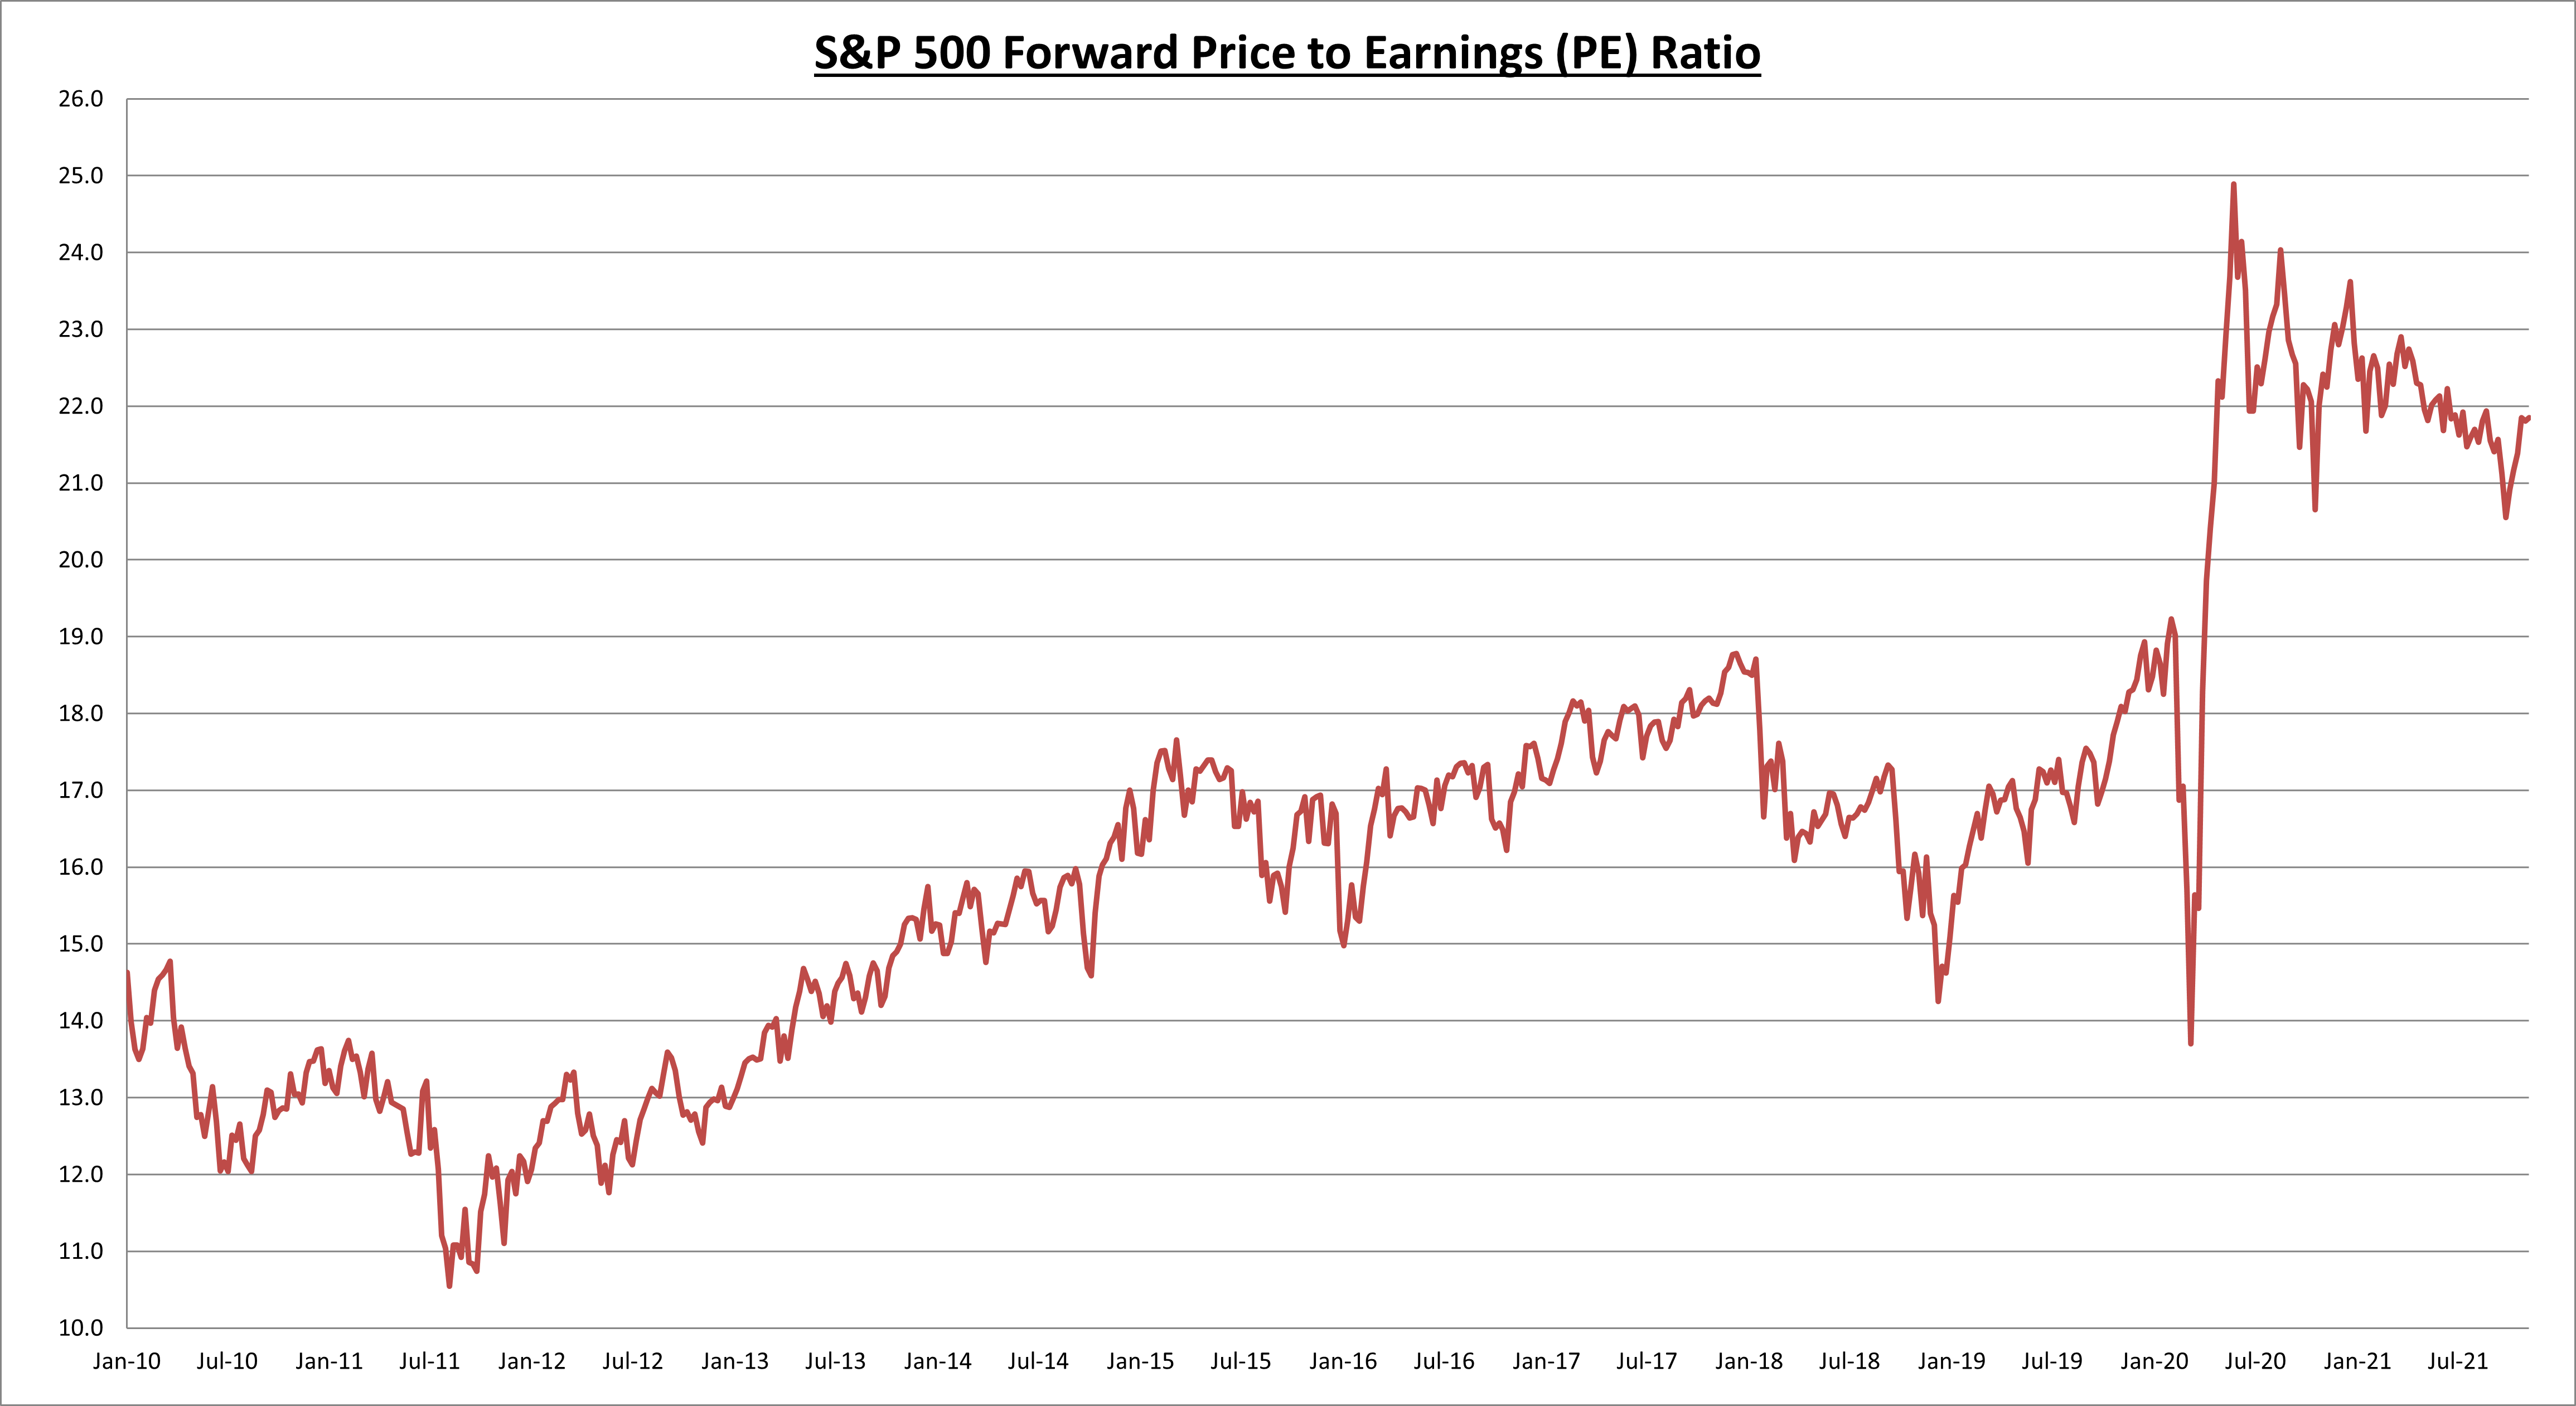
S&P 500 price to earnings (PE) ratio fell to 21.3, as earnings grew to another record while the S&P 500 declined -1.94% for the week.

S&P 500 earnings yield is now 4.69%, compared to the current 10 year treasury bond rate of 1.40%.

Economic data review

Producer Price Index (PPI) increased +0.8% in November, which was worse than expectations. Total PPI is now +9.7% higher over the last 12 months, versus the +8.8% annualized rate as of last month. Services prices increased +0.7% for the month, while goods prices rose +1.2%. Higher costs for producers are generally passed onto consumers.

NFIB small business optimism index showed a modest uptick for the month, from 98.2 to 98.4, but it remains a challenging environment.

“As the end of the year nears, the outlook for business conditions is not encouraging to small business owners as lawmakers propose additional mandates and tax increases. Owners are also pessimistic as many continue managing challenges like rampant inflation and supply chain disruptions that are impacting their businesses right now.”

The % of small business owners expecting better business conditions over the next 6 months declined to tie a 48 year low, and % of owners raising selling prices increased to the highest reading since 1979.

In total, 4 of the 10 index components improved for the month, while 4 declined and 2 were unchanged.

“The economy still has plenty of fuel to keep growing well into 2022. Economic policies in 2022, however, will become even more uncertain as it is an election year and the issues are diverse and high energy politically; tax increases, regulations, spending, climate, social goals, and government appointments, to name a few. Specifically of concern for small business owners is the current Build Back Better legislation which includes a significant tax increase for many. With a 50/50 Congress, anything can happen! And then there is Covid, which will continue to put its thumb on the scale of economic outcomes.”

Total retail sales for November came in below expectations at $639.8 billion (another record high), but still grew 0.3% for the month and +18.2% over the last 12 months. The monthly gain was led by gasoline (+1.7%), food & beverage stores (+1.3%), and food services & drinking places (+1.0%). It appears consumers made their holiday purchases early to avoid any shortages, which pulled forward some of the sales data into last month. If not for inflation (which increased 0.8% for the month) the November retail sales data could very well have been negative.

Retail sales data only covers the money spent on goods. We should continue to expect a gradual rotation in consumer behavior, shifting more purchases to services. Nothing wrong with that.

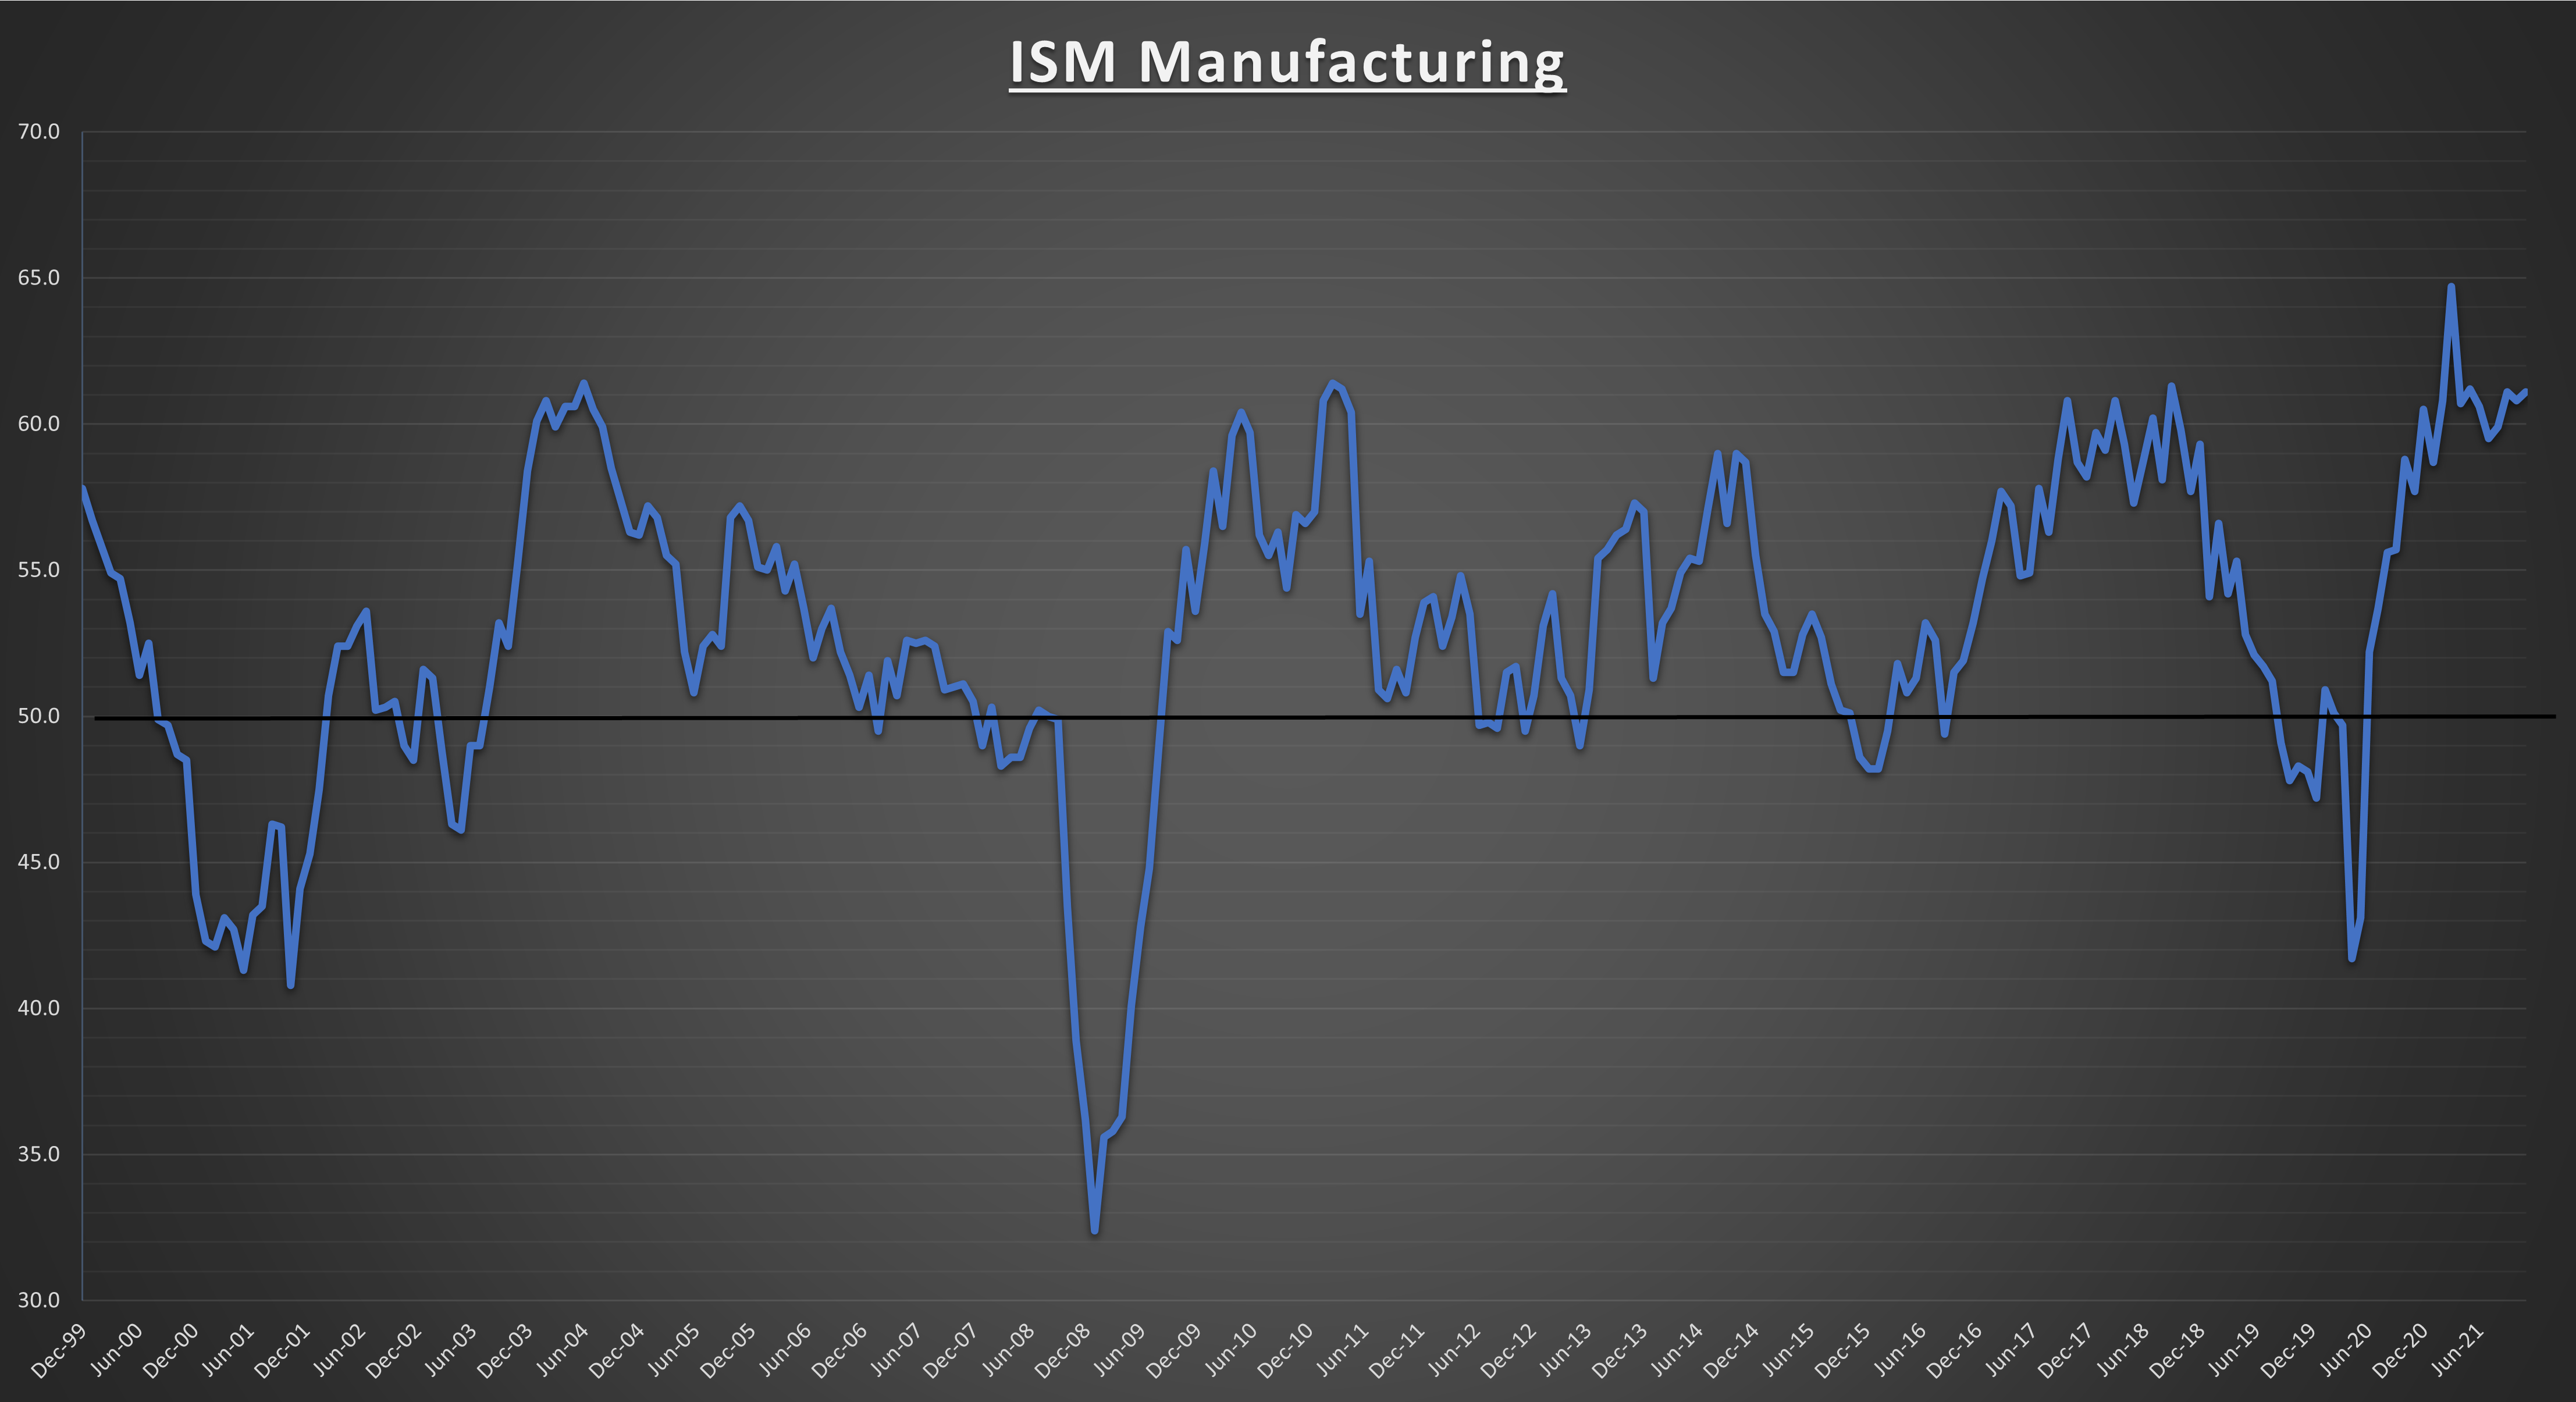
Industrial production for November increased +0.5% for the month, and +5.3% over the last 12 months. This was the highest industrial production reading since September 2019. Capacity utilization increased to 76.8 but remains below the long term average of 79.6.

Federal Open Market Committee (FOMC) gave its policy statement and economic projections. They announced a reduction to their monthly bond buying program by an additional $30 billion ($20B treasuries, $10B MBS), which means the program will now end in March as opposed to June. The Fed fell behind the curve by refusing to accept inflation wasn’t going to be transitory, and now they are pivoting to clean up the mess they helped create.

The above chart is the latest economic projections compared to where they were in September. The Fed now believes 2021 GDP will come in lower (5.5% compared to 5.9%), while 2022 GDP will come in a bit higher (4.0% compared to 3.8%). They expect PCE inflation for 2022 will come in at 2.7%, (compared to 2.3% estimate in September) which shouldn’t be taken seriously because they were so far off in 2021.

The majority of voting Fed members now expect three 25 basis point rate hikes for 2022, a sharp contrast from just a few months ago when the majority of voting Fed members projected zero rate hikes in 2022. Do you remember not too long ago when the Fed projected zero rate increases throughout 2023?

Notable earnings

Adobe (ADBE) reported quarterly adjusted EPS of $3.20, which was in line with expectations and 14% growth. Quarterly sales came in at $4.11 billion, which was 1% above estimates and 20% growth. The forward guidance for Q1 came in below expectations on both sales and earnings. The street was expecting EPS of around $3.39 but the guidance came in at $3.35, and sales expectations were approximately $4.33 billion while the company guided for $4.23 billion.

Not awful, but when you have a stock trading 20x sales and 40x forward earnings, any miss on forward guidance is likely to produce a negative short term reaction. In this case, reported results basically came in line with expectations and forward guidance was a miss. Not much for bulls to get excited about in the short term, but it doesn’t change the long term fundamental picture for one of the better run companies in the world.

Summary: The data continues to support the economic expansion, earnings are great and valuation remains reasonable. But it was all about the Fed this week. The Fed’s sharp pivot could have a negative effect on financial conditions in 2022. Financial conditions aren’t the ultimate driver of asset prices over the long term, but they can have a short term/temporary effect on markets. After the FOMC statement and projections, the yield curve (spread between short term and long term interest rates) continued to compress, from 80 to 75 basis points. The Fed mentioned that it could reduce its balance sheet (essentially sell its long term treasury holdings) to push up long term interest rates and give them more room to increase short term rates to fight inflation. This is interesting, the last time we had CPI running this high, the 10 year treasury bond rate was north of 10%!!!

Essentially this is a good thing. The sooner we can get back to a normalized monetary environment, the better. But we are in uncharted waters. Anyone who tells you they know exactly how this will play out is lying to you.

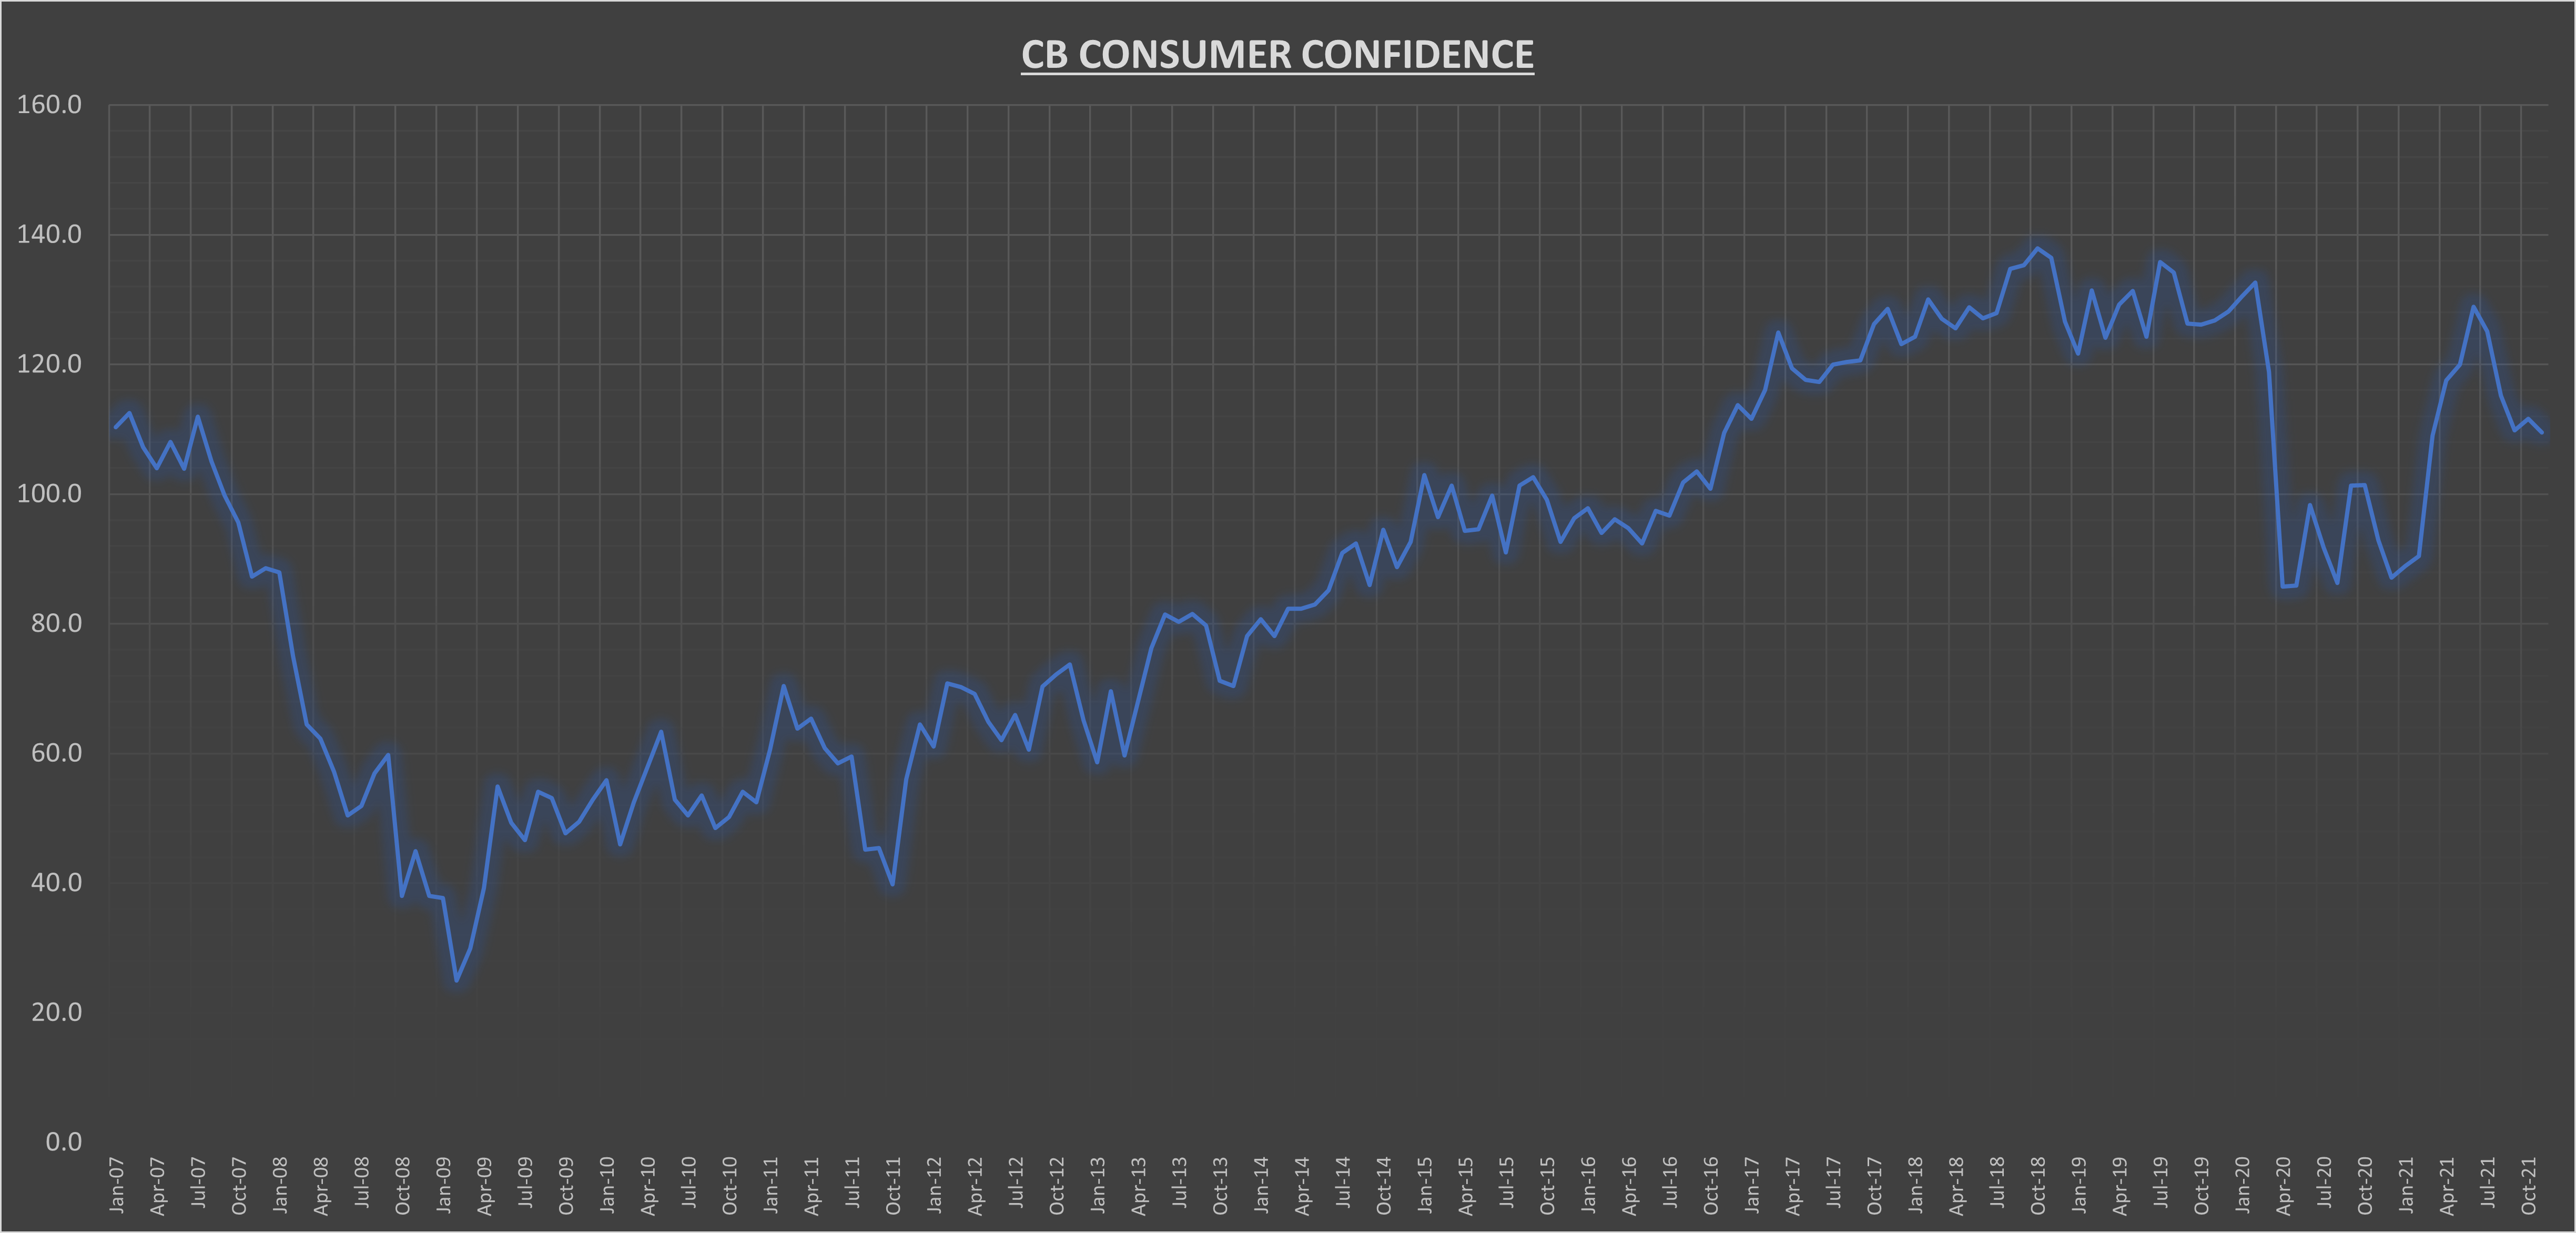
Next week: 6 S&P 500 companies will report quarterly earnings. For economic data we have the CB leading economic index (LEI) on Monday, the final reading on Q3 GDP, consumer confidence, & existing home sales on Wednesday, Core PCE, personal income and new home sales on Thursday.

Weekly stock market & economy recap

S&P 500 earnings update

S&P 500 earnings per share (EPS) showed a modest decline for the week, from $215.97 to $215.87.

S&P 500 price to earnings (PE) ratio increased to 21.8, as the index increased +3.8% this week.

S&P 500 earnings yield is now 4.58%, still well above the 10 year treasury bond rate currently at 1.49%.

Economic data review

Consumer Price Index (CPI) increased +0.8% in November, now +6.9% over the last 12 months (up from +6.2% last month).

Consumer Price Index minus food and energy (Core CPI) increased +0.5% in November, now +4.95% over the last 12 months (up from +4.6% last month).

These are the highest annualized inflation numbers in almost 40 years (1982). The monthly gains were led by energy (+3.5% – gasoline +6.1%), used cars and trucks (+2.5%), apparel (+1.3%), & new vehicles (+1.1%).

Household net worth rose to another record high, now $144.7 trillion, +1.7% for the quarter, and +17.7% higher than at this time last year.

In Q3, total assets grew 1.88% (from $160 trillion to $163 trillion), while total liabilities increased 1.7% (from $17.7 trillion to $18 trillion).

Over the last 15 years, total liabilities have increased only 34% (2% per year), while total assets have grown 103% during that same timeframe (4.8% per year).

Summary: In a slow week for earnings and data, it was all about inflation. Annualized CPI only got worse, but some downward pressure could be coming from the recent drop in oil prices.

Real yields are calculated by taking the nominal interest rate and subtracting the rate of inflation. As you can see in the chart above, real yields (as calculated by using total CPI) are staggeringly negative across the entire curve.

This entire botched monetary experiment hurts consumers (the inflation tax we all face everyday now) and savers. The only one that benefits from this is the Federal government, as they are able to borrow at low rates and pay back those debt obligations with much cheaper dollars in the future.

The 2 year treasury bond rate (short end of the curve) has been rising steadily for the last 3 months in anticipation of the Fed having to raise rates in 2022.

But here is the conundrum, there isn’t much room to raise short term rates without it negatively effecting financial conditions. The 10 year treasury bond rate (long end of the curve) is 1.49%, while the 2 year rate is 0.67%, which means there is a spread of only 80 basis points or so. The Fed may only have about three 25 basis point rate hikes of wiggle room before they are in danger of “inverting” the yield curve. Much like 2018. According to current market expectations, there is a better than 50% chance they raise rates 3 times by the end of 2022. Although right now I’d take the under on that one, my guess it’ll be more like 2 rate hikes in 2022. Who knows.

But we do know the anticipation is already having some negative impact on financial conditions. The St. Louis Fed financial stress index, although still very low, has been moving up in the last few weeks.

Bottom line, the Fed has lost credibility by refusing to believe that inflation wasn’t transitory. They’ve also fallen behind, and as a result the risk of a policy mistake has risen. Next week will be the main event, as the Fed gives its statement and their economic projections on Wednesday. We should gain more clarity on the pace of tapering asset purchases and rate increases.

The fundamentals remain strong but there are some challenges ahead. Financial conditions can effect liquidity in the markets, and when liquidity drops then volatility can increase. I can’t stress enough how important it is for investors to remain well diversified and disciplined.

Next week: 6 S&P 500 companies will be reporting earnings. I’ll be paying attention to Adobe (ADBE) on Thursday. For economic data, we have NFIB small business optimism index and the producer price index (PPI) on Tuesday, retail sales and the Fed statement along with economic projections on Wednesday, and Industrial production on Thursday.

Weekly stock market & economy recap

S&P 500 earnings

S&P 500 earnings per share (EPS) declined modestly this week, from $216.03 to $215.97.

99% of S&P 500 companies have now reported Q3 results. 81% have beat expectations and earnings have come in a combined 10.3% above estimates. Q3 earnings growth currently stands at +42.6%. (I/B/E/S data from Refinitiv).

S&P 500 price to earnings (PE) ratio fell to 21x, as the index declined -1.22% for the week.

S&P 500 earnings yield is now 4.76%, compared to the 10 year treasury bond rate which declined to 1.34%.

Economic data review

Consumer confidence declined in November, falling to 109.5 while October was also revised lower.

“Expectations about short-term growth prospects ticked up, but job and income prospects ticked down. Concerns about rising prices—and, to a lesser degree, the Delta variant—were the primary drivers of the slight decline in confidence. Meanwhile, the proportion of consumers planning to purchase homes, automobiles, and major appliances over the next six months decreased. The Conference Board expects this to be a good holiday season for retailers and confidence levels suggest the economic expansion will continue into early 2022. However, both confidence and spending will likely face headwinds from rising prices and a potential resurgence of COVID-19 in the coming months.”

Consumers expectations index – based on expectations for business conditions, labor markets, and financial prospects 6 months out – also declined labor market outlook and financial prospects expectations fell and business conditions outlook improved slightly.

Despite the disappointing monthly results, the consumer confidence index is still higher than it was at this point last year.

ISM Manufacturing Purchasing Managers Index (PMI) for November came in at 61.1, a slight increase over last month (60.8), and remains well in expansion territory (any reading above 50 indicates expansion).

“The U.S. manufacturing sector remains in a demand-driven, supply chain-constrained environment, with some indications of slight labor and supplier delivery improvement. All segments of the manufacturing economy are impacted by record-long raw materials and capital equipment lead times, continued shortages of critical lowest-tier materials, high commodity prices and difficulties in transporting products. Coronavirus pandemic-related global issues — worker absenteeism, short-term shutdowns due to parts shortages, difficulties in filling open positions and overseas supply chain problems — continue to limit manufacturing growth potential. However, panel sentiment remains strongly optimistic, with 10 positive growth comments for every cautious comment.”

New Orders improved from 59.8 to 61.5, employment improved from 52 to 53.3 and prices (input costs) declined from 85.7 to 82.4.

BLS employment report for November came in well below expectations, at 210K net jobs gained, the lowest since December 2020. Total private payrolls increased +235K, while government jobs decreased -25K. And September & October results were revised higher by a combined +82K jobs.

Average hourly earnings grew +0.3% for the month, and now +4.8% higher over the last 12 months.

We’ve now recovered 82.5% of the net jobs lost to the COVID recession, but still 3.912 million net jobs below the prior peak.

ISM Services Purchasing Managers Index (PMI) came in at a record high 69.1 for November.

“In November, record growth continued for the services sector, which has expanded for all but two of the last 142 months. Demand continues to outpace supply that has been impacted by capacity constraints, shortages of labor and materials, and logistical challenges. This has also caused demand-pull inflation that is affecting overall business conditions.”

New orders came in the same as last month (69.7), in strong growth territory, and input prices dropped slightly, from 82.9 to 82.3.

“The past relationship between the Services PMI® and the overall economy indicates that the Services PMI® for November (69.1 percent) corresponds to a 6.9-percent increase in real gross domestic product (GDP) on an annualized basis.” (emphasis mine)

Notable earnings

Salesforce (CRM) reported quarterly earnings that were 38% above street expectations, while sales came in 1% above street expectations and a growth rate of 27%. This was the first full quarter since the Slack acquisition and the company reported 51% sales growth in the platform/other segment (which includes Slack), along with 17% sales cloud growth, 21% service cloud growth, 20% data segment growth, and 25% marketing cloud growth.

The stock fell about 6% after earnings as the company gave its forward guidance of sales that came in better than expectations, but earnings guidance fell short.

“No other software company of our size or scale is really performing at this level. We know that because we’re talking to other cloud CEOs every day.”

Light earnings forecast doesn’t have a material impact in my opinion. Would look to add to the positions on any follow through on the sell off.

CrowdStrike (CRWD) reported adjusted EPS that was 70% above street expectations (+113% growth), on revenues that were 5% above expectations and 63% growth. Cash flow from operations grew 80%, and free cash flow grew 62%.

1,607 net new subscription customers were added for the quarter, bringing the running total up to 14,687 (+75% growth), and the company is expanding its relationship with the US government to provide endpoint protection and response. 68% of customers are using 4 or more modules (up from 61% last year), and 32% of customers are using at least 6 modules (up from 22% last year). Showing that the company is building a competitive advantage through the power of customer switching costs.

The stock is not cheap by any means (250x forward EPS & 40x sales), but its declined about 30% over the last few weeks. Would be looking to add to the positions if there is follow through.

Veeva Systems (VEEV) reported EPS that was 10% above expectations (24% growth), on revenues that were 2% above expectations (26% growth). The company continued to cite some short term issues facing commercial cloud software, anticipating a 10% reduction in the number of pharma sales reps across the industry. Q4 projections on sales ($478 to $480 million) came in slightly below street expectations, while Q4 EPS came in slightly above expectations ($0.88 actual vs. $0.87 estimate). Despite the near term headwinds, the $3 billion annual sales target by 2025 still looks well in tact.

DocuSign (DOCU) reported EPS that was 26% above street expectations (+164% growth) on sales that were 2.4% above expectations (+42% growth). But it was all about the billings & forward guidance, which was a big and unexpected miss. The company now expects $560 million in Q4 sales (street was expecting around $574 million), for a growth rate of approximately 32%, which would be the slowest quarterly sales growth rate since IPO. The weakness in billings suggests the soft sales forecast will last for awhile. As a result the stock is getting hammered (down about 30% as I type this). The company focused on meeting the sharp spike in demand, while lead generation fell short, and now they are paying the price for it.

Summary: The week began with some positive news regarding black Friday sales, with total sales coming in +29.8% above last year, as store traffic increased 42.9% (still down 28% compared to 2019). Still the COVID variant loomed in the background. We saw the effect that Delta had on Q3 GDP, so it seems inevitable now that Q4 and Q1 2022 economic growth estimates will need to be revised lower. But by how much?

By Tuesday it appeared the market was ready to move on but then Fed Chairman Powell thought it was a good time to finally admit the Fed was wrong all along to call inflation “transitory” (about a year too late Jay), and that a faster pace of tapering was warranted (which means rate increases likely coming even sooner). We still don’t have any idea what the economic effects of the new variant (because of draconian restrictions and mandates), still he thought this was a good time to surprise the market.

Then Wednesday Treasury Secretary Yellen maintains her stance that stimulus was “at most a small contributor to inflation”. So we are supposed to believe that a 30%+ increase in the money supply doesn’t have an inflationary effect. We have a real epidemic in regards to the lack of accountability from our elected officials. No one wants to take responsibility, they just want to pass the blame onto someone or something else. Not our finest week for the Fed Chair & Treasury Secretary. Odds of a policy mistake increase.

The data continues to support the recovery, but we may be starting to see inflation finally having a negative impact on demand. This week, Apple warned suppliers that iPhone 13 demand may be softening. Up to now consumers accepted higher prices because of stimulus offsets. We can’t count on that going forward.

It was an eventful week with some volatile market moves. We may be in the middle of a perfectly normal and healthy market correction, with growth stocks especially taking it on the chin, but the fundamentals continue to be supportive for risk assets.

Next week: 6 S&P 500 companies will be reporting earnings. For economic data we have the Consumer Price Index (CPI) on Friday.

Weekly stock market & economy recap

S&P 500 earnings update

S&P 500 earnings per share (EPS) increased to $216.03 this week. The forward EPS is now +36% year to date.

97% of S&P 500 companies have now reported Q3 earnings. 81% have beaten estimates, and results have come in a combined 10.2% above expectations. Q3 earnings growth rate is now +42.4%. (I/B/E/S data from Refinitiv)

S&P 500 price to earnings (PE) ratio dropped to 21.3 this week as a result of the increase in EPS and the drop in the price of the index.

S&P 500 earnings yield is now 4.7%, remaining well above the 10 year treasury bond rate, which declined to 1.49% this week.

Economic data review

Existing homes sales for October came in above expectations, at 6.34 million units, which was an increase of +0.8% over last month but down -5.8% from this time last year, as supply constraints fail to keep up with demand. The monthly gains were led by the Midwest (+4.2%) while the Northeast actually experienced a decline of 2.6%, the South was up 0.4%, and the West was unchanged.

“Home sales remain resilient, despite low inventory and increasing affordability challenges. Inflationary pressures, such as fast-rising rents and increasing consumer prices, may have some prospective buyers seeking the protection of a fixed, consistent mortgage payment.”

Median sales price for existing homes is now $353,900, which is +13.1% over the last 12 months. Price increases over the last 12 months were led by the South (+16.1%), Midwest (+7.8%), West (+7.7%), Northeast (+6.4%).

“Among some of the workforce, there is an ongoing trend of flexibility to work anywhere, and this has contributed to an increase in sales in some parts of the country. Record-high stock markets and all-time high home prices have worked to significantly raise total consumer wealth and, when coupled with extended remote work flexibility, elevated housing demand in vacation regions.”

Unsold inventory is now at a 2.4 month supply, still well below the 6 month supply level typically associated with a balanced market.

M2 money supply increased at an annualized rate of 13% in October, up from 12.9% last month and still well above the long term average of 6-7%. Little hope of reigning in the inflation threat until this number reverts back below the historical average without raising the short term Fed Funds rate, which probably isn’t going to happen until summer 2022 at the earliest.

Second estimate of Q3 real Gross Domestic Product (GDP) came in at +2.1%, slightly better than the first estimate (+2.0%). Real GDP is now +1.4% above the pre-COVID peak.

Q3 remains the slowest quarter of economic growth since the COVID recession, but all signs point to much stronger growth in Q4, with the latest Atlanta Fed GDP Now estimate coming in at +8.2%.

Weekly unemployment claims fell to 199K, back below pre-COVID levels. You actually have to go back to 1969 to find a better result. Another good sign for the labor market.

New home sales for October increased +0.4%, to 745K. Sales are still down -23.1% over the last 12 months, as supply constraints and labor shortages limit the production of new homes.

Median sales price for new homes increased +0.7% in October, to $407,700. Median sales price for new homes has risen +17.5% over the last 12 months. Strong demand and lack of supply keeps prices high.

Personal Consumption Expenditures minus food & energy (Core PCE) increased +0.4% for the month, in line with expectations. Core PCE is now +4.1% over the last 12 months, up from the 3.7% annualized rate last month. Much like the CPI, annualized PCE inflation is at its highest level since November 1990.

Real personal incomes excluding transfer payments increased +.04% in October, for another all-time high, and +1.4% over the last 12 months. Despite the increases, it still doesn’t compete with the rise in consumer prices of between 4-6%. Proving to be a hidden tax on consumers.

Notable earnings

Zoom (ZM) reported quarterly earnings that were only +2% above expectations, a +12% growth rate. This was the smallest quarterly beat since the company went public. Sales came in +3% above expectations and a +35% growth rate.

“Through innovation and dedication, we will continue to deliver happiness to our customers. Looking forward, we expect to close the year between $4.079 to $4.081 billion in total revenue, representing approximately 54% year-over-year growth, alongside strong profitability and operating cash flow growth. We are well on our way to becoming an indispensable platform for enterprises, individuals, and developers to connect, collaborate, and build in the flexible hybrid world of work. We believe our global brand, innovative technologies, and large customer base position us well for the future.”

Though the pace of sales growth has slowed, the company’s profitability has improved marginally. Customers contributing over $100K in revenue over the last 12 months grew 94%, and Q4 projections came in a little above street expectations.

Despite record sales and earnings, the stock price has hit a new 52 week low and down today about 15%. The stock went from $60 to $600 last year, so some consolidation was to be expected. The above chart shows the pace of sequential quarterly sales growth since IPO. After spiking during the pandemic, its growth rate has slowed to a standstill. Q3 sequential sales growth was a new company low at +2.9%, and according to the company’s projections, Q4 sequential sales growth will be 0%.

I think the market is overreacting but I don’t have high conviction on this. Strong competition from Microsoft and Cisco, slowing sales, & an eventual return to normalcy, could have an effect for awhile.

Summary: The week began with current Fed chair Powell getting renominated by the President for another 4 year term. I’m scoring this as a positive only because it alleviates some uncertainty that would have come with a new Fed chair. The slew of economic data this week largely reinforced the expansion is still well in tact, as well as the inflation threat. Personal incomes are rising but not at the pace of cost increases (inflation) when we subtract government transfer payments. With overall transfer payments slowing down (or stopping altogether), price increases could be especially painful for consumers going forward.

FOMC meeting minutes from the November meeting were released this week. It appears more Fed voting members are open to speeding up the reduction of its bond buying program, which could push forward the timeframe for the first increase in short term interest rates. “Various participants noted that the (policy-setting) Committee should be prepared to adjust the pace of asset purchases and raise the target range for the federal funds rate sooner than participants currently anticipated if inflation continued to run higher than levels consistent with the Committee’s objectives.” We can only hope.

By the end of the holiday shortened week, all the focus returned to the ongoing COVID saga. Markets fell at the thought of more restrictions. Couple points to remember, 1) too soon to draw any conclusions, and 2) volumes on Friday were very low due to the holiday and the half day (markets closed at 1PM EST), which likely exacerbated the market moves. We’ve all been left guessing, since few if any market participants are experts on infectious diseases. It’s best to focus on what is tangible at the moment, earnings are great, valuations are reasonable, rates remain low, and barring anymore lockdowns there is a low risk of recession in the next 6-12 months.

Next week: 9 S&P 500 companies will be reporting earnings next week. I’ll be paying attention to Salesforce (CRM) on Tuesday, Crowdstrike (CRWD) and Veeva systems (VEEV) on Wednesday, and Docusign (DOCU) on Thursday. For economic data we have consumer confidence on Tuesday, ISM Manufacturing on Wednesday, ISM Services & the BLS employment report on Friday.

Weekly stock market & economy recap

S&P 500 earnings update

S&P 500 earnings per share (EPS) increased to $215.03 this week. The forward EPS remains +35% year to date.

95% of S&P 500 companies have now reported Q3 results. 81% have beaten estimates and results have come in a combined 10.3% above expectations. Q3 EPS growth is now +42.3%. (I/B/E/S data from Refinitiv)

S&P 500 price to earnings (PE) ratio remains 21.8.

S&P 500 earnings yield is 4.58%, which still compares favorably to fixed income alternatives, with the 10 year treasury bond rate at 1.53%.

Economic data review

Total retail sales increased to a record $638.2 billion in October. An increase of 1.7% from last month (which was revised higher), and an increase of 16.3% over the last 12 months. Total retail sales are now +21.4% above the pre-COVID peak.

The monthly gains were led by nonstore retailers (ecommerce) +4%, gasoline stations (+3.9%), and electronics/appliance store (+3.8%).

Industrial production increased 1.6% in October, and +5.1% over the last 12 months. The index has now completed recovered from the COVID decline and at its highest levels since December 2019.

Capacity utilization increased to 76.4% in October, but still below the long term average of 79.6%.

Manufacturing increased +1.2% for the month, led by a surge in motor vehicle assemblies (+18.8% for the month, 9.1 million units).

Conference Board’s Leading Economic Index (LEI) hit another record in October, increasing +0.9% for the month and +9.3% over the last 12 months.

“The U.S. LEI rose sharply in October suggesting the current economic expansion will continue into 2022 and may even gain some momentum in the final months of this year. Gains were widespread among the leading indicators, with only the average workweek and consumers’ outlook making negative contributions.

However, rising prices and supply chain bottlenecks pose challenges to growth and are not expected to dissipate until well into 2022. Despite these headwinds, The Conference Board forecasts growth to remain strong in the fourth quarter at around 5.0 percent (annualized rate), before moderating to a still historically robust rate of 2.6 percent in Q1 2022.”

Notable earnings

Nvidia Corp. (NVDA) posted another record quarter, with earnings coming in +8% above Wall Street expectations and +83% growth over last year.

Sales came in at $7.1 billion (+4% above expectations and a 50% growth rate), led by strong gains in the company’s gaming and data center divisions. Gross margins also improved from 62.6% to 65.2%.

NVDA now expects Q4 revenue to come in around $7.4 billion, which would be a growth rate of 48%.

Intuit (INTU) reported EPS that was 58% above expectations, and 63% year over year growth. Sales came in 11% above expectations and 52% higher than last year. The company also raised full year 2022 sales guidance to 26%-28% growth. The growth was led by the small business and self employed segments, along with Credit Karma.

“We are off to a strong start in fiscal year 2022, delivering on our strategy of becoming an AI-driven expert platform powering the prosperity of consumers and small businesses. We continue to see strong momentum and proof that our Big Bets are further positioning us for durable growth in the future, and we’re delighted that Mailchimp has joined Intuit.”

Intuit expects the Credit Karma segment to grow approximately 80% in fiscal 2022. And the recent acquisition of Mailchimp should significantly effect top line sales results in 2022 as well.

Long term shareholder in both companies. They both remain some of my favorite non-FAANG stocks. Both crushing it in their own ways, but the stock prices have gone parabolic, with Nvidia up +146% and Intuit up +93% over the last year, compared to the S&P 500 at +31%. The stocks would have to pull back quite a bit before I’d even consider adding to positions.

Summary: Upbeat news from retail giants Walmart and Home Depot kicked off the week. Both companies reported earnings that beat expectations and both raised forward guidance. The total retail sales confirmed with a nice beat, coming in well above the inflation rate (+1.7% retail sales vs. +0.9% inflation). We also got some upbeat news within the industrial production report that showed signs auto production is picking up. Hopefully the worst of the supply chain issues in the auto manufacturing sector are behind us.

We also got a ton of Fed speak as we get closer to finding out who the next Fed chair will be. What is being overlooked is the composition of the Fed’s voting members is likely to become even more “dovish” next year, as a few of the more hawkish voting members are set to be replaced. Bad policy mistakes plus onerous restrictions/mandates are the largest contributors to the current problems. They are trying to fix problems they themselves created and their projections are losing credibility by the day.

Let’s not forget that at this time last year the Fed was projecting inflation to be around 1.8%. What a miss that was! Their most recent estimates for 2022 inflation is around 2.2%, which will likely be wrong as well. It amazes me that we have a real Fed Funds rate of -6% and a real 10 year treasury yield of -4.5%, yet at the same time the Fed is still expanding its balance sheet, albeit at a slower pace. Frankly, given this backdrop I’m kind of surprised stocks aren’t even higher than they are.

Regular readers know the mantra of this blog is earnings and interest rates are what ultimately drive stock prices, not scary headlines or doomsday predictions. The biggest near term threat would be a spike in interest rates. I still see this as a lower probability event right now, but the odds increase for every month inflation remains overheated. The good news is that with an earnings yield of 4.6%, there is a decent size cushion for interest rates to rise before it threatens stock valuations IMO.

Next week: 12 S&P 500 companies will report Q3 results. I’ll be paying attention to Zoom (ZM) on Monday. For economic data we have existing home sales on Monday, and on Wednesday we’ll get the second estimate for Q3 GDP, Core PCE inflation, new home sales & personal incomes.